
Content ROI: How to Calculate It vs Ad Spend
It offsets paid ads, then outlasts them. The costs, the returns, the timeline, and how to run the content ROI math yourself.
 By David Jubé · May 1, 2026 · 11 min read
Paid traffic stops the hour the budget does. A ranked article keeps returning the same visit, month after month, with no further spend, and that one difference is what makes content’s return compound while paid ads stay flat.
Content marketing ROI is the attributed value the content earns minus its total cost, divided by that cost, expressed as a percentage and measured cumulatively over time rather than from a single month. That last clause does the work. Measure content in one month and it looks like a loss, because the cost lands up front and the return arrives later.
This article gives you the formula, a worked calculation on real example numbers, the timeline to expect, and the comparison the generic ROI guides skip: how much paid spend a single compounding article actually offsets.
Key takeaways
- Content marketing ROI is attributed value minus total content cost, divided by that cost, and it only makes sense measured cumulatively over time rather than in a single month.
- The honest formula counts all the cost, including your own labor, and credits content only for the value you can defensibly attribute.
- In the worked example, a $900 article returns roughly 167 percent in year one and keeps offsetting about $2,400 in annual ad spend every year it ranks.
- ROI starts negative because cost leads and return lags, then turns positive at the crossover point where cumulative value passes cumulative cost, usually between six and twelve months.
- Content is an owned asset and paid ads are rented: a published article lowers blended customer acquisition cost because its cost is sunk once while every later customer it earns is effectively free at the margin.
The formula, stated plainly
Here is the calculation, in one line:
Content ROI = (attributed value − total content cost) ÷ total content cost × 100
Two inputs, and both are easy to fudge if you are not honest.
- Total content cost is everything it took to publish and promote the piece: writing, editing, design, the SEO work, plus the share of tools and labor behind them. The number founders forget is their own time, or a writer’s. Leave labor out and the ROI looks better than it is, which is a lie you eventually pay for.
- Attributed value is the revenue or pipeline you can credibly trace to the content, not all the value you wish you could claim. Credit the article for the customers it can reasonably be tied to, and resist the urge to count every visit as a near-sale. A practitioner walkthrough of how to measure content marketing ROI covers the metrics that feed each input, and the discipline behind crediting only what you can defensibly attribute is what separates a real number from a hopeful one.
The honest version of this formula counts all the cost and only the defensible value. It will read lower in month one. It will read far higher in month twelve.
A worked example: one article over twelve months
Numbers make this concrete. Take a single satellite article, the kind a founder publishes to answer one real buyer question, and run it through a full year.
- Cost to produce. Research, writing, editing, a simple graphic, and the time to publish and promote it: call it $900 of blended labor and tools. This is the sunk cost, paid once.
- Organic visits over twelve months. It takes a few months to rank, then settles. Say it earns 150 organic visits a month at a steady state, for roughly 1,200 visits across the year as it ramps and holds.
- Conversion rate to a tracked next step. A focused, stage-matched page converts a small but real share of readers. At a 2% conversion to a booked call or signup, those 1,200 visits produce about 24 conversions.
- Customer value. Not every conversion closes. If one in four becomes a customer worth $400 in first-year value, that is 6 customers and $2,400 in attributed value from one article.
- The ROI. Run the formula: ($2,400 − $900) ÷ $900 × 100 = roughly 167% in year one. The cost was paid once. The 167% is before year two, when the same article keeps earning with no new spend.
Now the part the generic guides leave out. To buy those same 1,200 visits through paid search at a modest $2 per click, you would spend about $2,400 over the year. Next year, to keep them, you spend $2,400 again.
The article that cost $900 once offsets roughly $2,400 in ad spend every year it keeps ranking. That offset, not the first-year percentage, is the real return.
These are example figures, not a promise. Your conversion rate, customer value, and cost per click decide the actual numbers. The point is the shape: a one-time cost against a recurring, compounding return.
Step-by-step versions of this calculation and a practitioner method for measuring it cumulatively walk the same inputs if you want to model your own.
The Content ROI Model: cost, value, crossover
The worked example is one article. The model is the library. Here is the spine to keep.
The crossover point is the number that matters, and it is the one a single-month view can never show you. Content ROI starts negative on purpose: the cost leads and the return lags. Cumulative value climbs past cumulative cost somewhere in the middle of the timeline, and after that the curve is the part founders actually want.
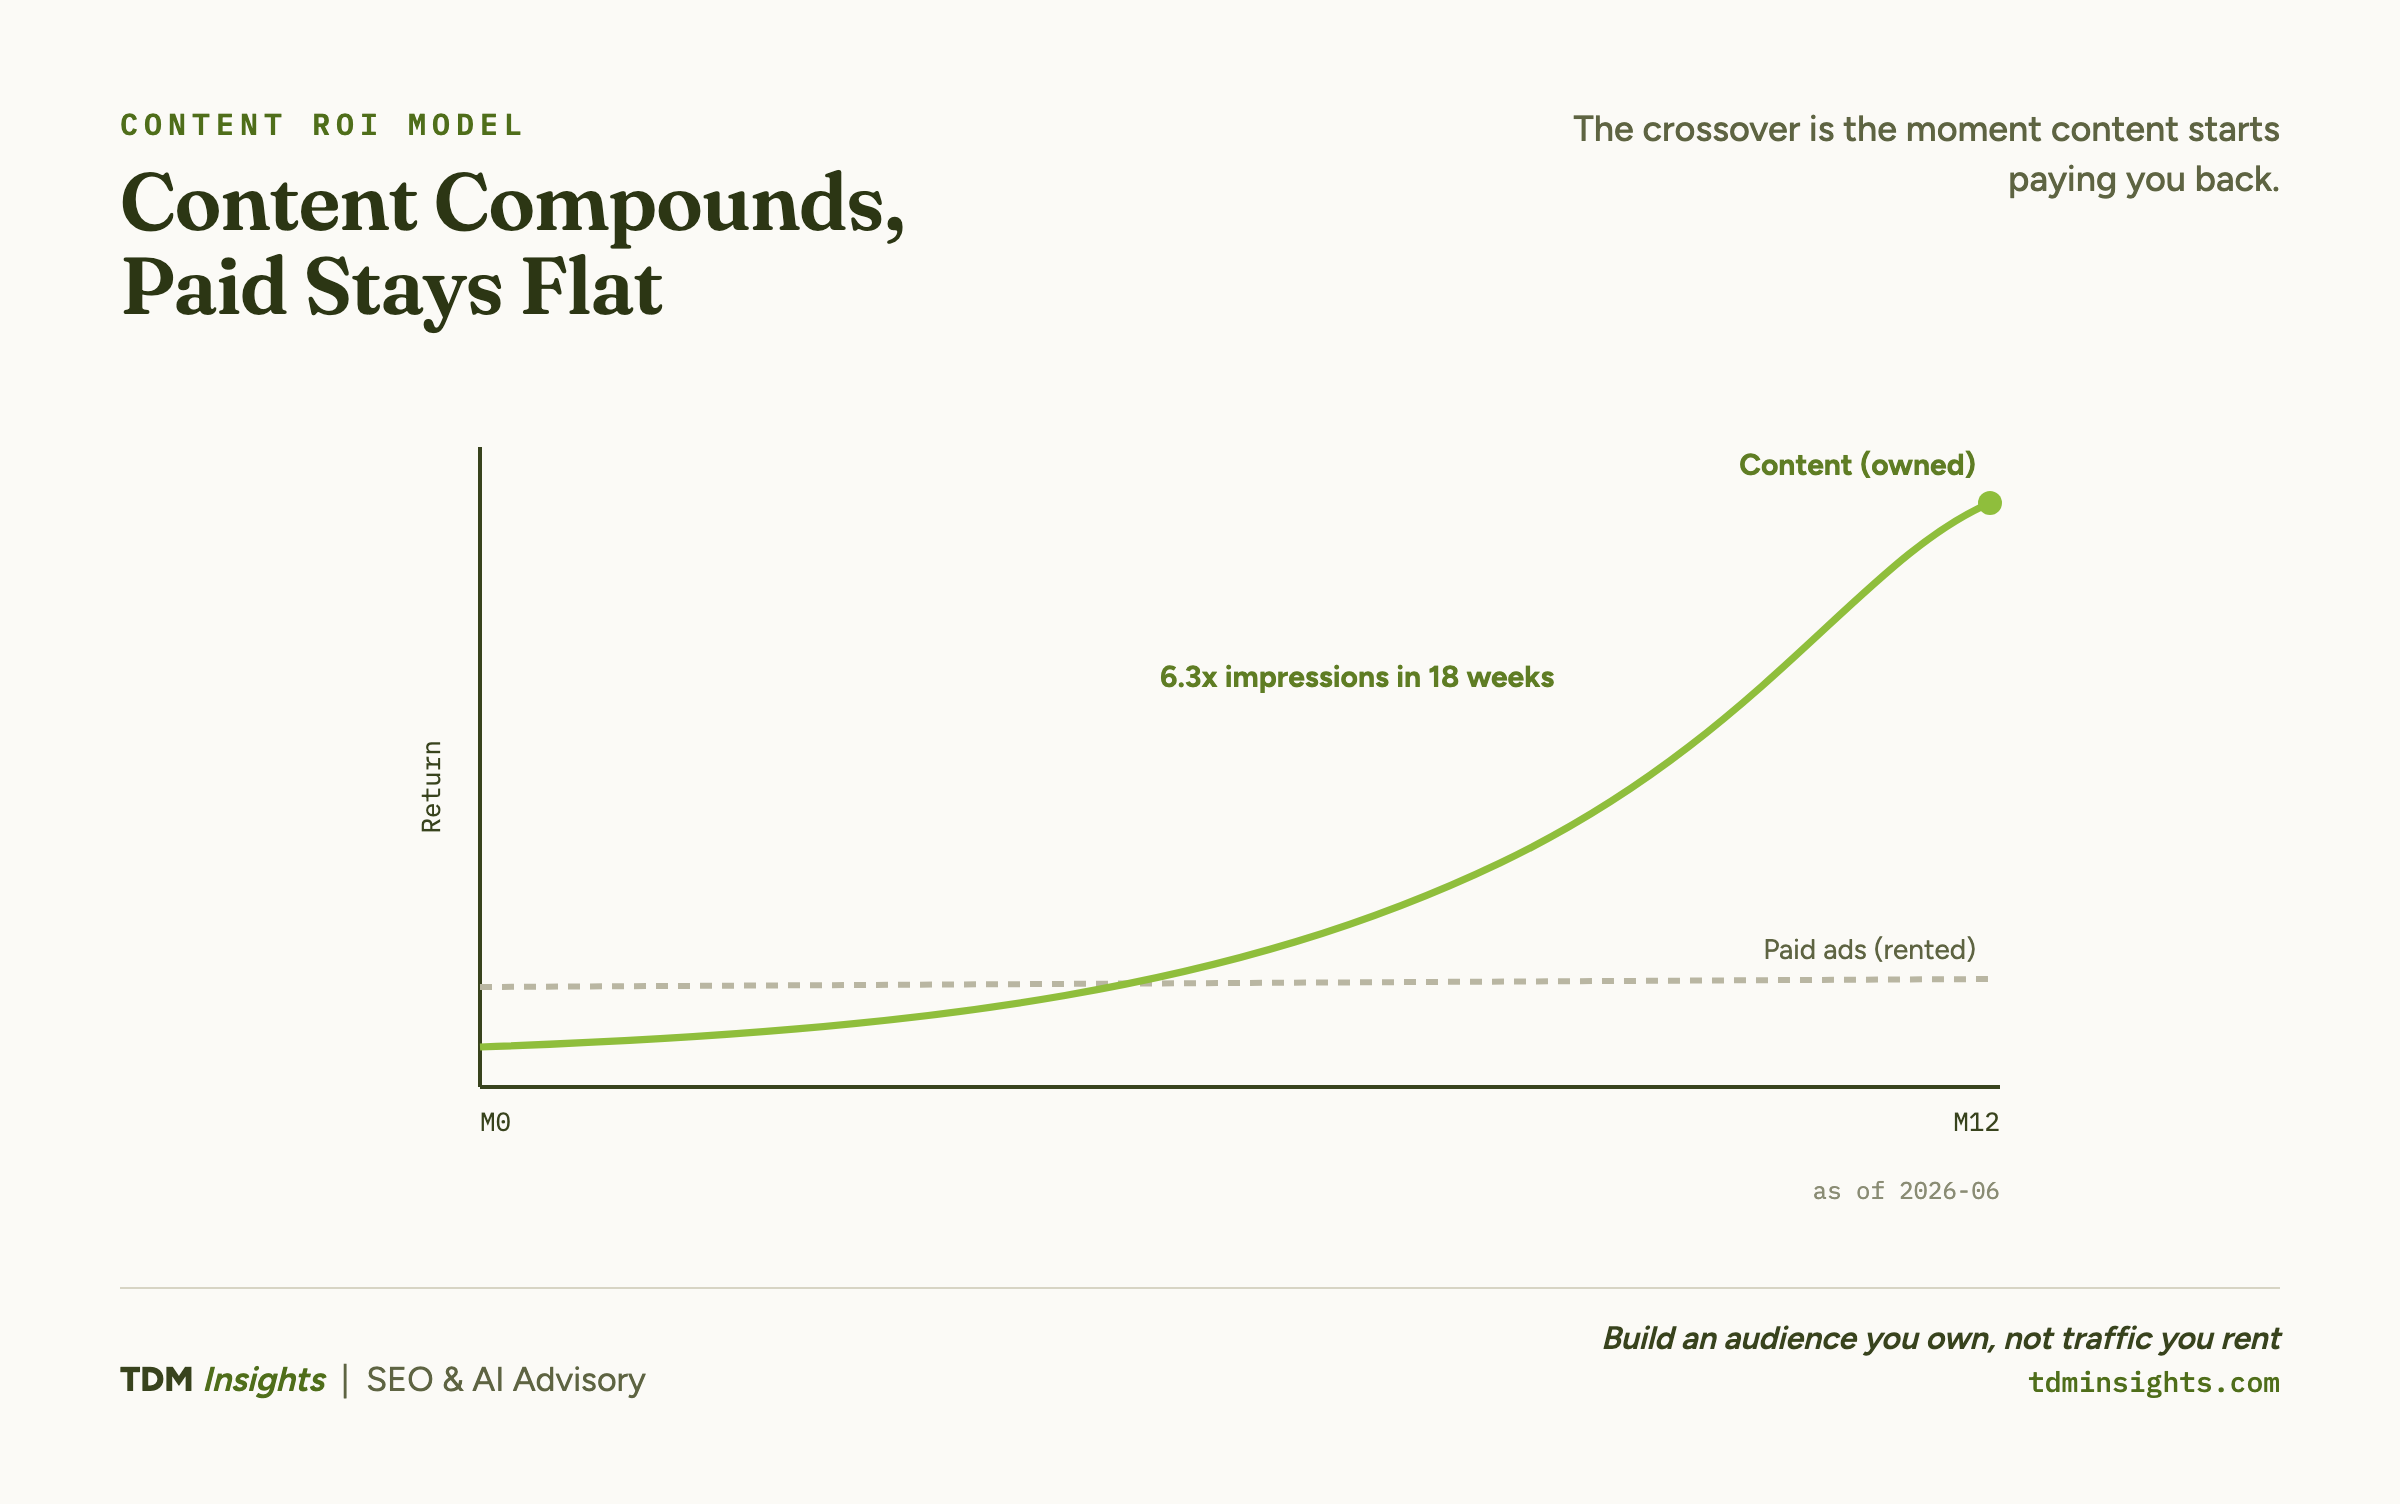
Plot cumulative cost and cumulative value on the same timeline and the crossover is the moment the investment starts paying you back. The case for why organic value compounds is the engine under that curve, and benchmark ROI data by industry gives you a reference range to sanity-check your own model against.
The dollar figure in the model rests on the organic metrics underneath it: impressions, rankings, clicks, and conversions. Getting that measurement right is a discipline of its own, which is why this article hands the underlying organic tracking off to the tools that measure search and AI visibility rather than reinventing it here.
Book a free diagnosis
Founder to founder, the most useful version of this is not a formula, it is your actual numbers. A free diagnosis takes your real traffic, your conversion rate, and your current ad spend, then models what a compounding content library could offset over the next twelve months and where your crossover point likely sits. You leave with a straight read on whether content earns its place in your acquisition mix, no deck and no retainer pitch.
How content compares to paid ads over time
Paid ads and content are not rivals to pick between. They are tools with opposite timelines, and the honest comparison is about when each one pays.
Paid traffic is rented. The moment you stop paying, it ends, and you own nothing you can point back to.
Content is owned. Once an article ranks, it earns impressions and clicks without the meter running, and each new related article raises the authority of the others. The full owned-versus-rented case for content offsetting paid spend lays this out across a longer horizon, and an analysis of content ROI against other channels puts numbers on the same comparison.
The right answer is usually both, weighted by your stage. Early on, paid buys you the speed and the data content cannot give you yet. As the library grows, content carries more of the load and pulls your blended cost down.
That tradeoff depends on your runway as much as your math, and whether SEO is worth it before you are ready to wait for it is the prior question worth settling first.
Why a published article lowers your acquisition cost
Content lowers blended customer acquisition cost (CAC) for one structural reason: its cost is sunk once, but its return continues.
Spend $900 on an article, and that $900 is paid whether it earns one customer or fifty. Every customer it brings in after it ranks is effectively free at the margin, because no new spend produced them.
Paid ads never reach that point. The next customer always costs you the next click.
So as the library grows, each compounding article takes on more of the acquisition work, and the blended cost across all channels falls. The CAC-lowering mechanism behind owned content is exactly this: a fixed cost spread across a growing, recurring return.
This is the conceptual case for converting the readers content earns, and it depends on the funnel doing its job. An article that ranks but converts no one lowers nothing. The ROI math only works on top of the structure, so write for content with market fit first, then measure them.
How long until content ROI turns positive?
Expect months, not weeks. Content has to rank and accumulate value before the return arrives, so ROI reads negative early while cost leads and value lags.
Measurable results typically show up in the three-to-six-month range, with a clearer positive curve between six and twelve months, assuming you publish consistently and choose topics for intent rather than raw volume. The timeline view of content returns against cost tracks the same lag across many programs, and an honest timeline for how long SEO takes lines up with the same months-not-weeks shape.
The pattern is consistent enough to plan around. The programs that measure outcomes and optimize for them outperform the ones that measure publishing volume.
We refined this exact model on a site we operate before bringing it to clients, and a structured library lifted search impressions 10.1x in 28 weeks at The Gourmet Host with no added spend. That is the compounding curve in practice: the same articles, still earning, long after the cost was paid.
Plug the number into a decision
The reason to calculate content ROI is not to file a report. It is to decide how to spend your next acquisition dollar.
Run the formula on your real numbers, find your crossover point, and the comparison answers itself.
- If your library has crossed over, every dollar you move from paid into content compounds.
- If it has not crossed over yet, you know how much paid to keep running while it gets there.
Either way you are making the call on math instead of instinct, which is the whole point of measuring.
A founder who knows their content ROI and their crossover point stops guessing about the acquisition mix. The article that paid for itself this year keeps paying next year, and that is the asset paid traffic can never become.
Frequently Asked Questions
How do I calculate the ROI of content marketing?
Content ROI is attributed value minus total content cost, divided by total content cost, expressed as a percentage. Total cost includes writing, editing, design, and promotion plus the tools and labor behind them. Attributed value is the revenue or pipeline you can credibly trace to the content. Measure it cumulatively over time, not from a single month.
What costs and returns go into the content ROI formula?
Costs include the labor of creating, editing, and distributing content, plus SEO and any tools or freelancers. Returns include revenue from content-attributed customers, the pipeline it influenced, and the paid traffic it replaces. The honest version counts labor, which founders forget, and credits content only for value you can reasonably attribute, not all of it.
How does content ROI compare to paid ads over time?
Paid ads deliver fast but stop the moment you stop paying. Content starts slower and negative, then compounds, because published articles keep earning traffic with no further spend. Over a long enough horizon content typically shows stronger ROI, while paid ads remain better for short-term bursts. The right answer is usually both, weighted by your stage.
How long until content ROI turns positive?
Expect months, not weeks. Content takes time to rank and accumulate value, so ROI starts negative while costs lead and returns lag. Measurable results typically arrive in the three-to-six-month range and a clearer positive curve by six to twelve months, assuming consistent publishing and topics chosen for intent rather than volume alone.
How does content reduce my customer acquisition cost?
Content lowers blended customer acquisition cost because its cost is sunk once but its return continues. A published article keeps earning traffic and customers with no additional spend, so each customer it brings in afterward is effectively free at the margin. As the library grows, it carries more of the acquisition load and pulls the blended cost down.
Why does content keep returning value after the cost is sunk?
Because a ranking article is an owned asset, not a rented placement. Once it ranks, it earns impressions and clicks month after month without further payment, and each new related article raises the authority of the others. That compounding is why a structured library lifted search impressions 10.1x in 28 weeks at The Gourmet Host with no added spend.
Continue Reading:
More On Content Conversion:
- How to Build a Content Funnel (TOFU to BOFU)
- The One-CTA Rule: One Ask Per Page Wins
- Landing Page Copy vs Blog Copy: The Difference
- Where to Place a CTA So It Gets Clicked
- Content-Market Fit: Earn Customers, Not Traffic
More from TDM Insights:
- Content That Converts Readers Into Customers
- SEO and AI Visibility Tracking Tools, Compared
- Is SEO Worth It for a Startup?
- How Long Does SEO Take? An Honest Timeline
- Content Strategy for Founders
Explore TDM Insights Categories: